
Reading a Miner Profitability Table Without Chasing the Top Row
A ranking sorts machines by the money they make at today's price and difficulty, and the top row is almost never the right purchase for a small operator. At 46 TH/s the network pays 2.064e-05 BTC a day, about $1.75 gross and $1.68 after the listed 4% on the block-reward component, while a 460 TH/s unit returns 0.00020636 BTC and $17.48 gross. The gap between those two rows is ten times the hash and ten times the power draw.

Key takeaways
- 46 TH/s generates 2.064e-05 BTC a day, $1.75 gross and $1.68 net; 460 TH/s generates 0.00020636 BTC, $17.48 gross and $16.78 net.
- At 20 J/TH and $0.06 per kWh, the 460 TH/s machine burns $13.25 of power a day against $16.78 of net income.
- A ranking row is a snapshot of one price and one difficulty, so re-read it whenever either input moves.
- Efficiency in joules per terahash usually separates two machines that look identical in the gross column.
What a ranking actually compares
The table takes a list of ASIC models, applies the current BTC price and network difficulty to each model's advertised hashrate, and prints the resulting daily revenue. That is a narrow calculation dressed as a broad recommendation. It knows nothing about your electricity tariff, your cooling, your noise constraints or the capital you have available, and each of those can flip the order of two machines that sit next to each other in the list.
The useful part is the shared basis. Because every model is measured with the same inputs, the ranking is a fair way to compare silicon against silicon. It is a poor way to compare a purchase against your own situation, which is why the row you pick should be the one that survives a second calculation rather than the one printed at the top.
Why the gross column flatters big machines
Revenue scales with hashrate in a straight line. A 460 TH/s unit earns ten times what a 46 TH/s unit earns, and the listed fee takes the same percentage from both. If that were the whole story, everyone would buy the largest machine available and the ranking would be a price list.
Power does not scale in a straight line with the revenue you keep. It scales with watts, and watts are set by the efficiency of the design. A machine at 20 J/TH draws 20 watts for every terahash it produces, so its electricity bill per terahash is fixed regardless of how many units you run. Two models with the same hashrate and different efficiency can finish the month in different places even though the ranking shows them side by side.
Three columns the ranking leaves out
The first is your marginal power price, not the average on your bill. The second is the cost of the space and cooling needed to run the unit at its rated speed, which for a small site often means a derated machine and a lower effective hashrate than the table assumes. The third is the resale value of the hardware in twelve months, which is the part of the return that a daily revenue column cannot express.
None of that makes the table wrong. It makes it a starting point. The operators who get value from a profitability list use it to eliminate models, not to select one, and they do the elimination with a power figure in hand before they look at the revenue figure.
Putting the three bands on one page
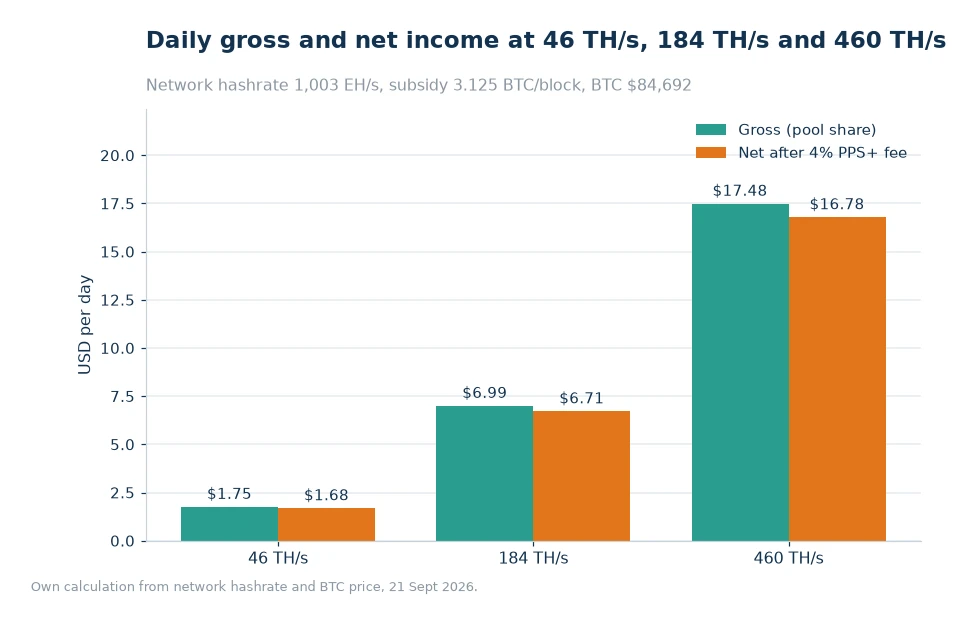
Before comparing brands, it helps to see what the network pays for three quantities of hash under one set of inputs. The figures below use a network hashrate of 1,003 EH/s, a subsidy of 3.125 BTC per block across 144 blocks a day, and a BTC price of $84,692.
| Hashrate | Daily BTC | Gross income | Net after the listed 4% |
|---|---|---|---|
| 46 TH/s | 0.00002064 | $1.75 | $1.68 |
| 184 TH/s | 0.00008255 | $6.99 | $6.71 |
| 460 TH/s | 0.00020636 | $17.48 | $16.78 |
The middle row matters more than it looks. 184 TH/s is four times 46 TH/s, and the income is four times as well, which confirms the linear relationship. A single mid-size machine therefore lands in the same place as four small ones on revenue, and the decision between them turns on power, noise and rack space rather than on the payout formula.
What the ranking is good for
Used properly, ViaBTC Miner Ranking answers a specific question: given today's conditions, which models still produce more revenue than the electricity they consume at a stated rate. That is a filter, and a filter is exactly what a shortlist needs at the start.
Run the list twice, once with your own tariff and once with a tariff 50% higher. Models that survive both are the ones worth pricing from a supplier. Models that vanish in the second pass are a bet on cheap power continuing, which is a bet you may not want to place with hardware that takes a year to pay back.
Worked example
Take a 460 TH/s machine with a rated efficiency of 20 J/TH and run the whole position, revenue and cost, on one page.
- Share of network hash: 460 divided by 1,003,000,000 TH/s equals 4.59e-07.
- Daily coins: 4.59e-07 multiplied by 450 BTC equals 0.00020636 BTC.
- Gross dollars: 0.00020636 multiplied by $84,692 equals $17.48.
- Listed fee: 4% of $17.48 is $0.70, which leaves $16.78 net.
- Power draw: 460 TH/s at 20 J/TH is 9,200 W, or 9.2 kW.
- Daily energy: 9.2 kW multiplied by 24 hours equals 220.8 kWh.
- Daily power cost: 220.8 kWh at $0.06 per kWh equals $13.25.
- Margin before other costs: $16.78 minus $13.25 equals $3.53 a day, or roughly $106 for a 30-day month.
- Same test at 46 TH/s: 920 W, 22.08 kWh, $1.32 of power against $1.68 net, leaving $0.36 a day.
Turning the shortlist into a decision
A shortlist of three models is enough. For each one, write the purchase price, the rated hashrate, the rated watts and the efficiency. Then compute two numbers: the daily net revenue from the pool formula, and the daily power cost at your tariff. Subtract the second from the first and divide the purchase price by the result. That quotient is the payback period in days, before cooling and before any change in difficulty.
Then stress it. Raise difficulty by 10%, cut the BTC price by 20%, and raise your tariff by a third. Any machine that still clears its power bill in that scenario is a reasonable candidate; the ones that go negative are a wager on perfect conditions. This is dull work compared with reading a leaderboard, and it is the difference between owning hardware and owning a bill.
Keep the inputs current. Difficulty is estimated to fall 2.12% at the next adjustment, which lifts revenue per terahash slightly, and any change of that size shifts every row in a ranking at once. Push the same inputs through a mining profit calculator before you commit, and treat the ranking as the first filter rather than the final answer.
Frequently asked questions
Does the top of the ranking mean the right machine to buy?
Not usually. The top row is the highest revenue under today's inputs, and revenue ignores what the machine costs to buy, to power and to cool, which is where most purchase decisions are actually settled.
How often should the ranking be re-read?
Whenever BTC price or difficulty moves enough to change a decision, and at minimum once a month, since a 2.12% difficulty change already shifts revenue across every row.
Why does a 460 TH/s machine earn ten times a 46 TH/s machine?
Because the payout formula is linear in hashrate: 0.00020636 BTC a day against 0.00002064 BTC, with the same listed rate applied to both.
Price the power before the hardware
The most useful thing you can do this week is not browse listings. It is to find your real marginal electricity rate, multiply it by the daily kWh of the machine you are considering, and hold that number against the pool's net payout. When the gap is comfortable, the ranking row becomes a business case. When the gap is thin, no position in the list will fix it.
Sources: published pool fee and settlement terms[1], with chain inputs read 21 Sept 2026: network hashrate about 1,003 EH/s, difficulty 132.76 T, subsidy 3.125 BTC per block, 144 blocks a day and BTC at $84,692. Figures read 21 Sept 2026, published 22 Oct 2026. Power costs use a stated $0.06 per kWh and will differ at your site.